
Owning the AI Build-Out


Most investors approach artificial intelligence as a stock-picking problem. Find the company that will win, buy it, and hope the price was reasonable. Others treat it as a theme: buy a basket, hold it, and let the story play out. Both framings are observations of an underlying trend.
Every durable economic trend moves in cycles. Output, earnings and asset prices each have two parts: a long-run path and the swings around it. Economists have measured both since Arthur Burns and Wesley Mitchell published Measuring Business Cycles at the National Bureau of Economic Research in 1946.[1] The distinction is standard economics. What is less standard is building a portfolio around both halves at once (Exhibit 1).
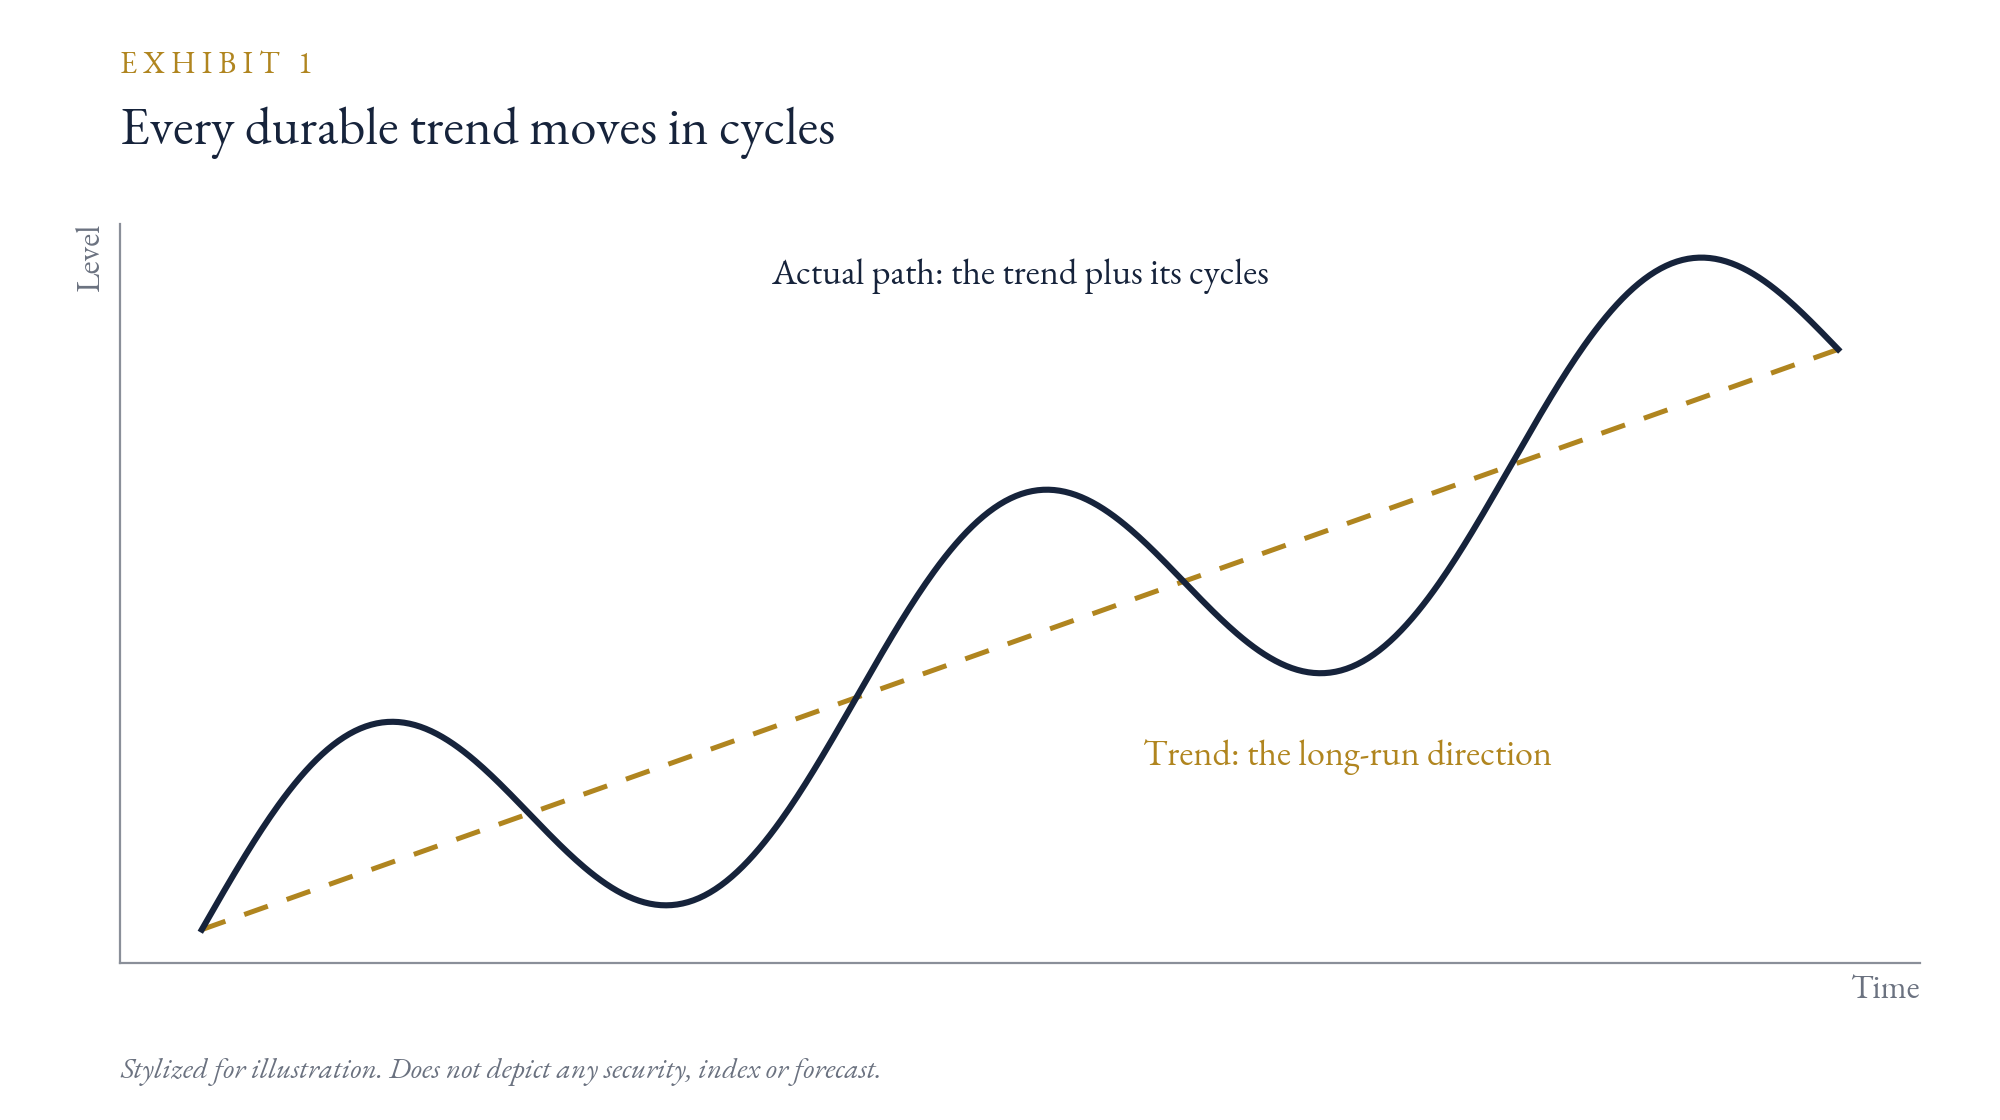
Buy-and-hold captures the long-run compounding of a trend, but it absorbs every cycle in full and buys at whatever price the moment offers. Tactical trading responds to the swings but often loses the trend, and in a taxable account much of any gain goes to tax. Each approach is right about half the problem. Our view is that the trend should decide what we own, and the cycle should decide how we hold it. The build-out of the AI economy is the clearest current test of that principle.
The Trend Shows Up in Physical Data
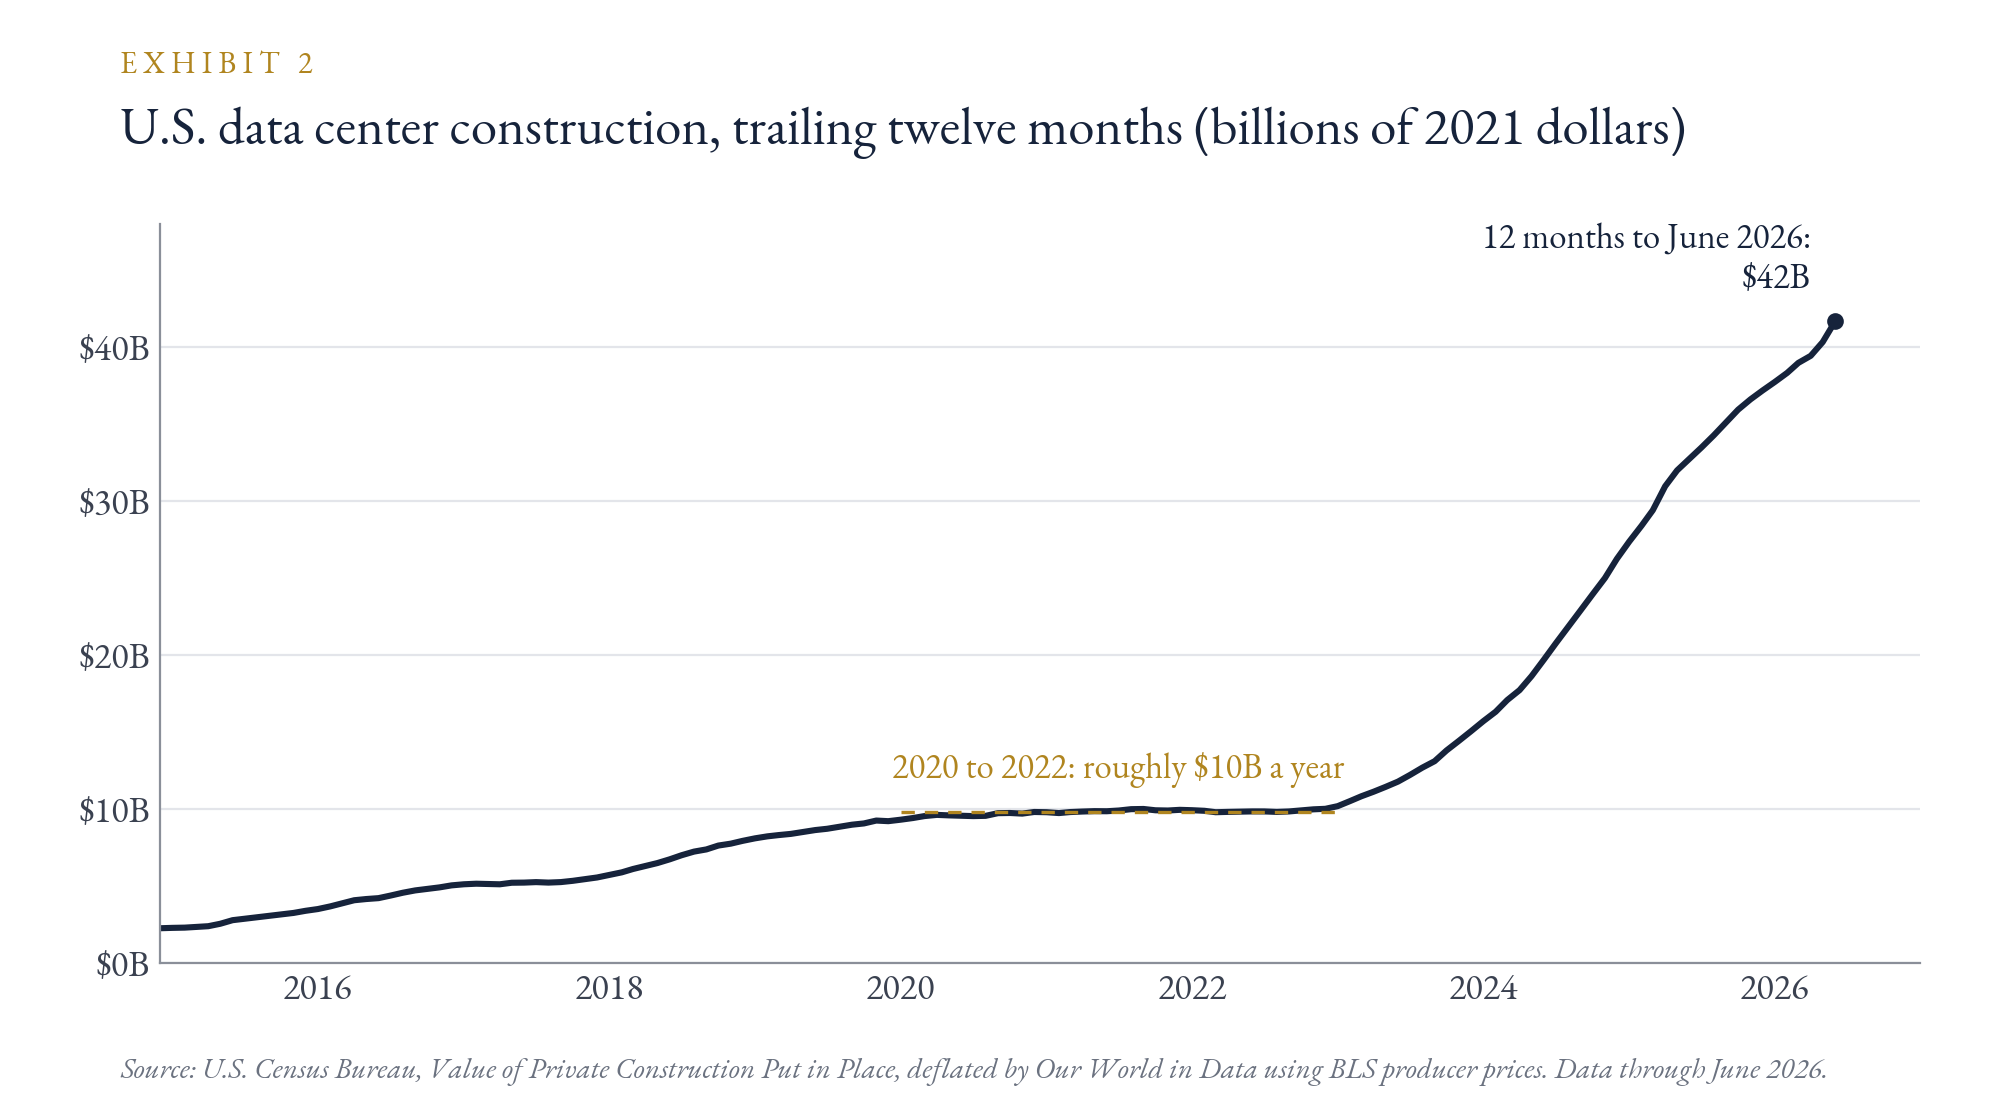
Claims about AI are easy to make and hard to check. The physical record is easier. Private spending on data center construction reached an annual rate of roughly $75 billion in July 2026, up 57% from a year earlier.[2] Measured in inflation-adjusted terms over trailing twelve months, spending has more than quadrupled from the level of about $10 billion a year where it held from 2020 through 2022 (Exhibit 2). Alphabet, Amazon, Meta and Microsoft have guided to more than $700 billion of combined capital spending in 2026, up from roughly $410 billion in 2025.[3]
Electricity data tell the same story from the other side. U.S. power consumption was essentially flat for about fifteen years. The Energy Information Administration now expects 2027 to be a third consecutive record year, at 4,349 terawatt-hours.[4] Lawrence Berkeley National Laboratory estimated that data centers used 4.4% of U.S. electricity in 2023 and projected a range of 6.7% to 12% by 2028.[5] Forecasts are the views of their authors, and a wide range is an honest one. But the direction is not in dispute, and none of these figures depend on anyone's opinion about which AI model is best.
We Have Studied This Shape Before
The Koios framework began with research on long cycles in real metals prices. That work found that metals move in cycles lasting decades, each tied to a major industrialization: U.S. industrial expansion, post-war reconstruction, and China's build-out in the 2000s.[6] As we wrote in The Shape of Commodity Cycles, the mechanism is slow capital. A new mine takes roughly a decade from discovery to production. Generation and transmission take years to permit and build. When demand outruns capacity, prices stay high long enough to call forth new supply.
The AI build-out has that shape. Data centers need power at a scale that strains existing grids. New generation needs turbines, transformers, copper and uranium, all with lead times measured in years. That makes it a candidate for the next long cycle in physical inputs. A candidate, not a certainty. But it is the reason we do not think of AI as a technology theme alone.
The Complete Loop
The AI economy is better understood as a chain than as a sector. Demand originates at the top, with the applications that people and companies pay for: models, software, cloud services, security and robotics. Capital to meet that demand flows down through four layers, each dependent on the one beneath it (Exhibit 3). Applications run on compute: processors, memory, networking and the data centers that house them. Compute runs on power and infrastructure: generation, grid equipment and construction. And power runs on resources: copper, uranium and critical minerals.
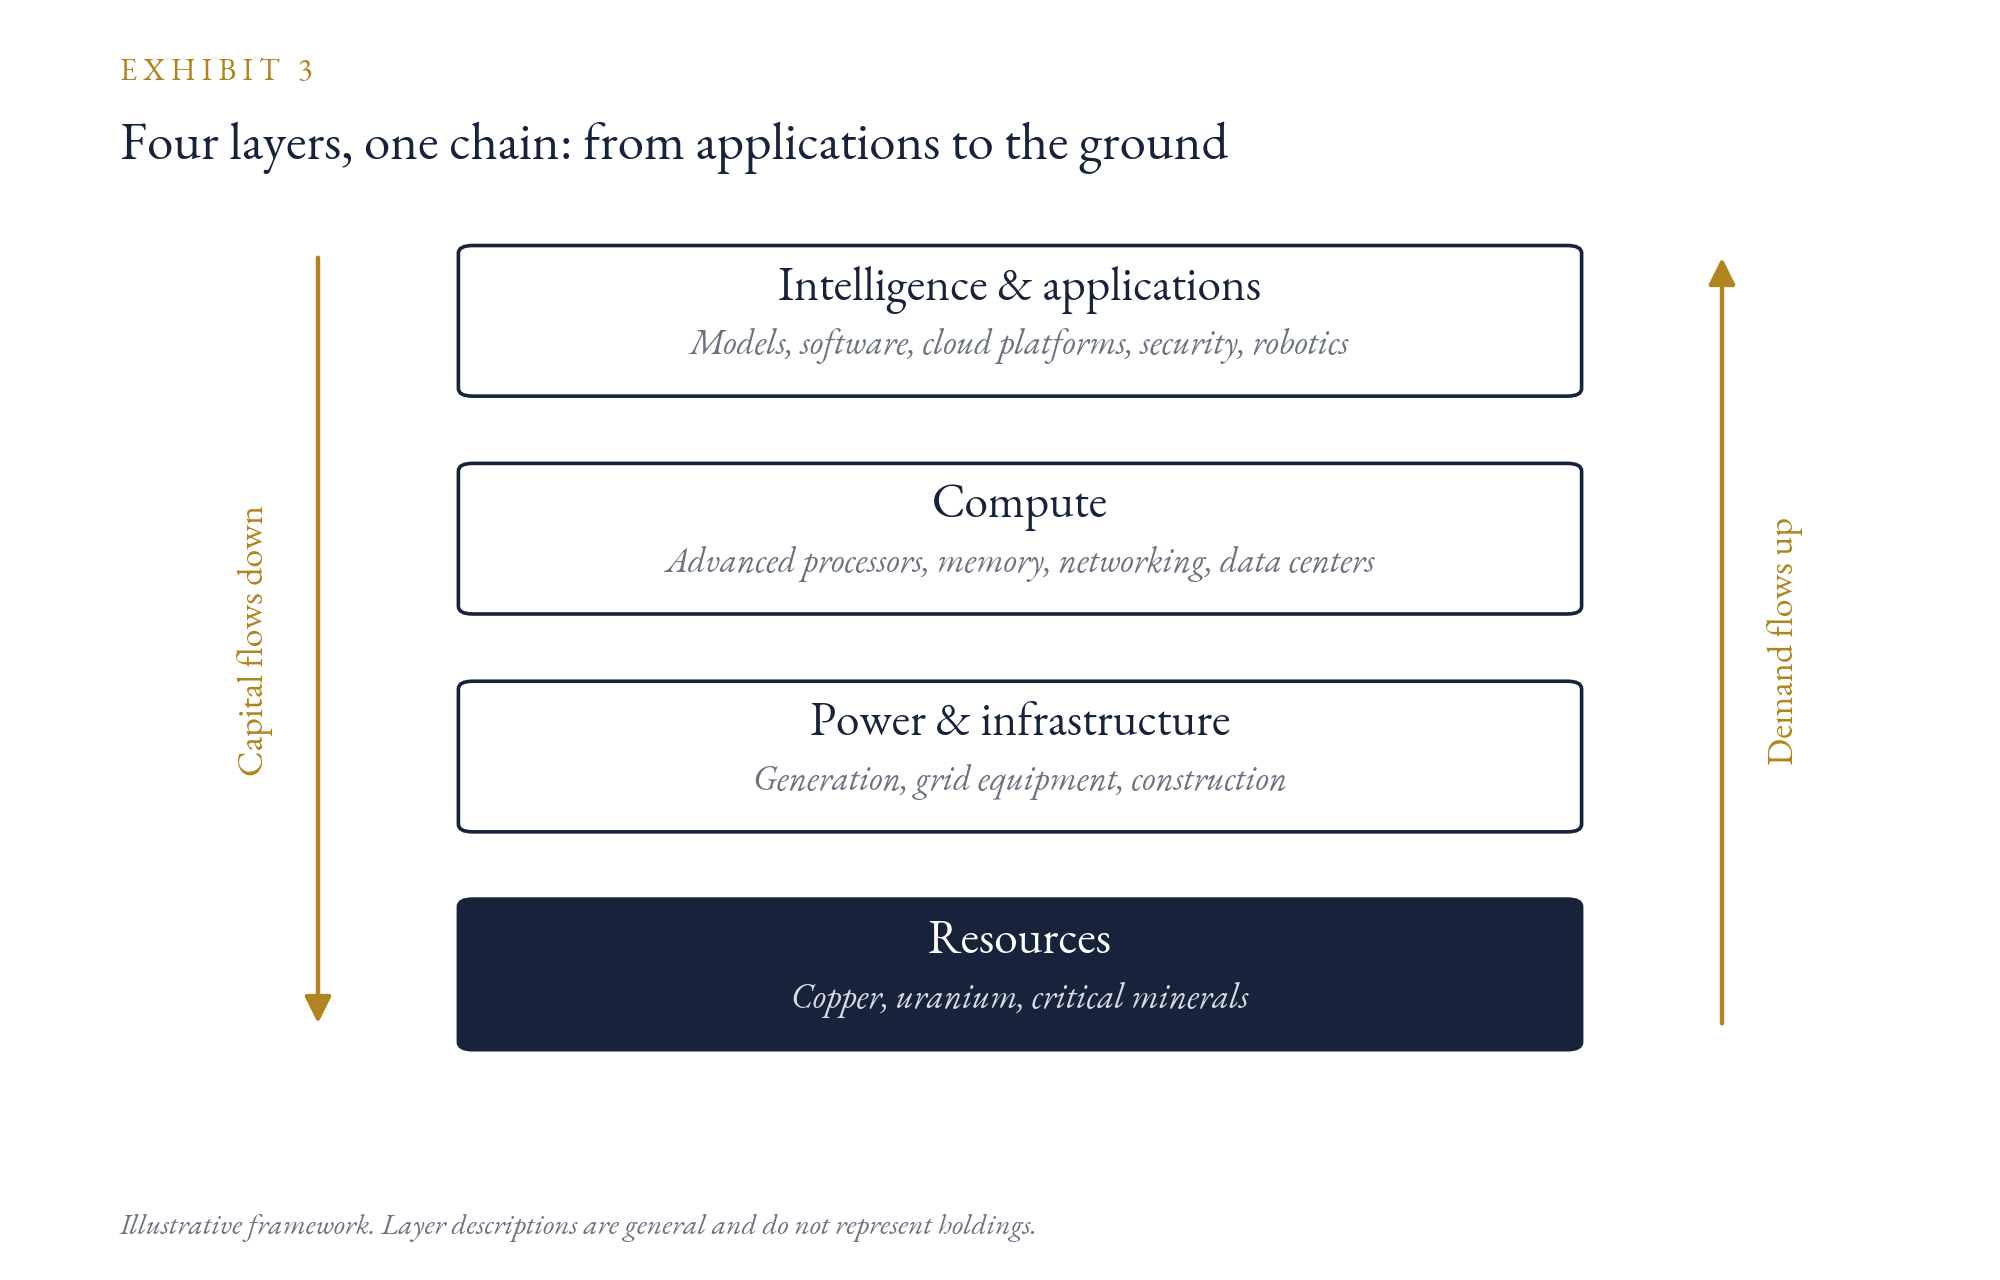
Most AI portfolios stop at the chip. The complete loop runs to the ground.
That matters because returns tend to follow the bottleneck. Early in the build-out, the supply of advanced processors set the pace. Then data center space and cooling ran short as demand outran construction. Today, interconnection queues and equipment lead times gate new capacity, and further down the chain sit the mines, where supply responds most slowly of all. The layer that constrains the build-out tends to hold pricing power while the constraint lasts. Owning the full chain means not having to guess which layer comes next.
One Trend, Four Clocks
If all four layers moved together, a single static allocation would be enough. They do not. The same trend runs through each layer, but each cycles around it at a different speed (Exhibit 4). Application companies move with valuation and sentiment, which can swing over months to a few years. Semiconductors follow inventory and capacity cycles of a few years. Power and grid follow capital-spending cycles that run several years. Metals follow supply cycles of a decade or more.
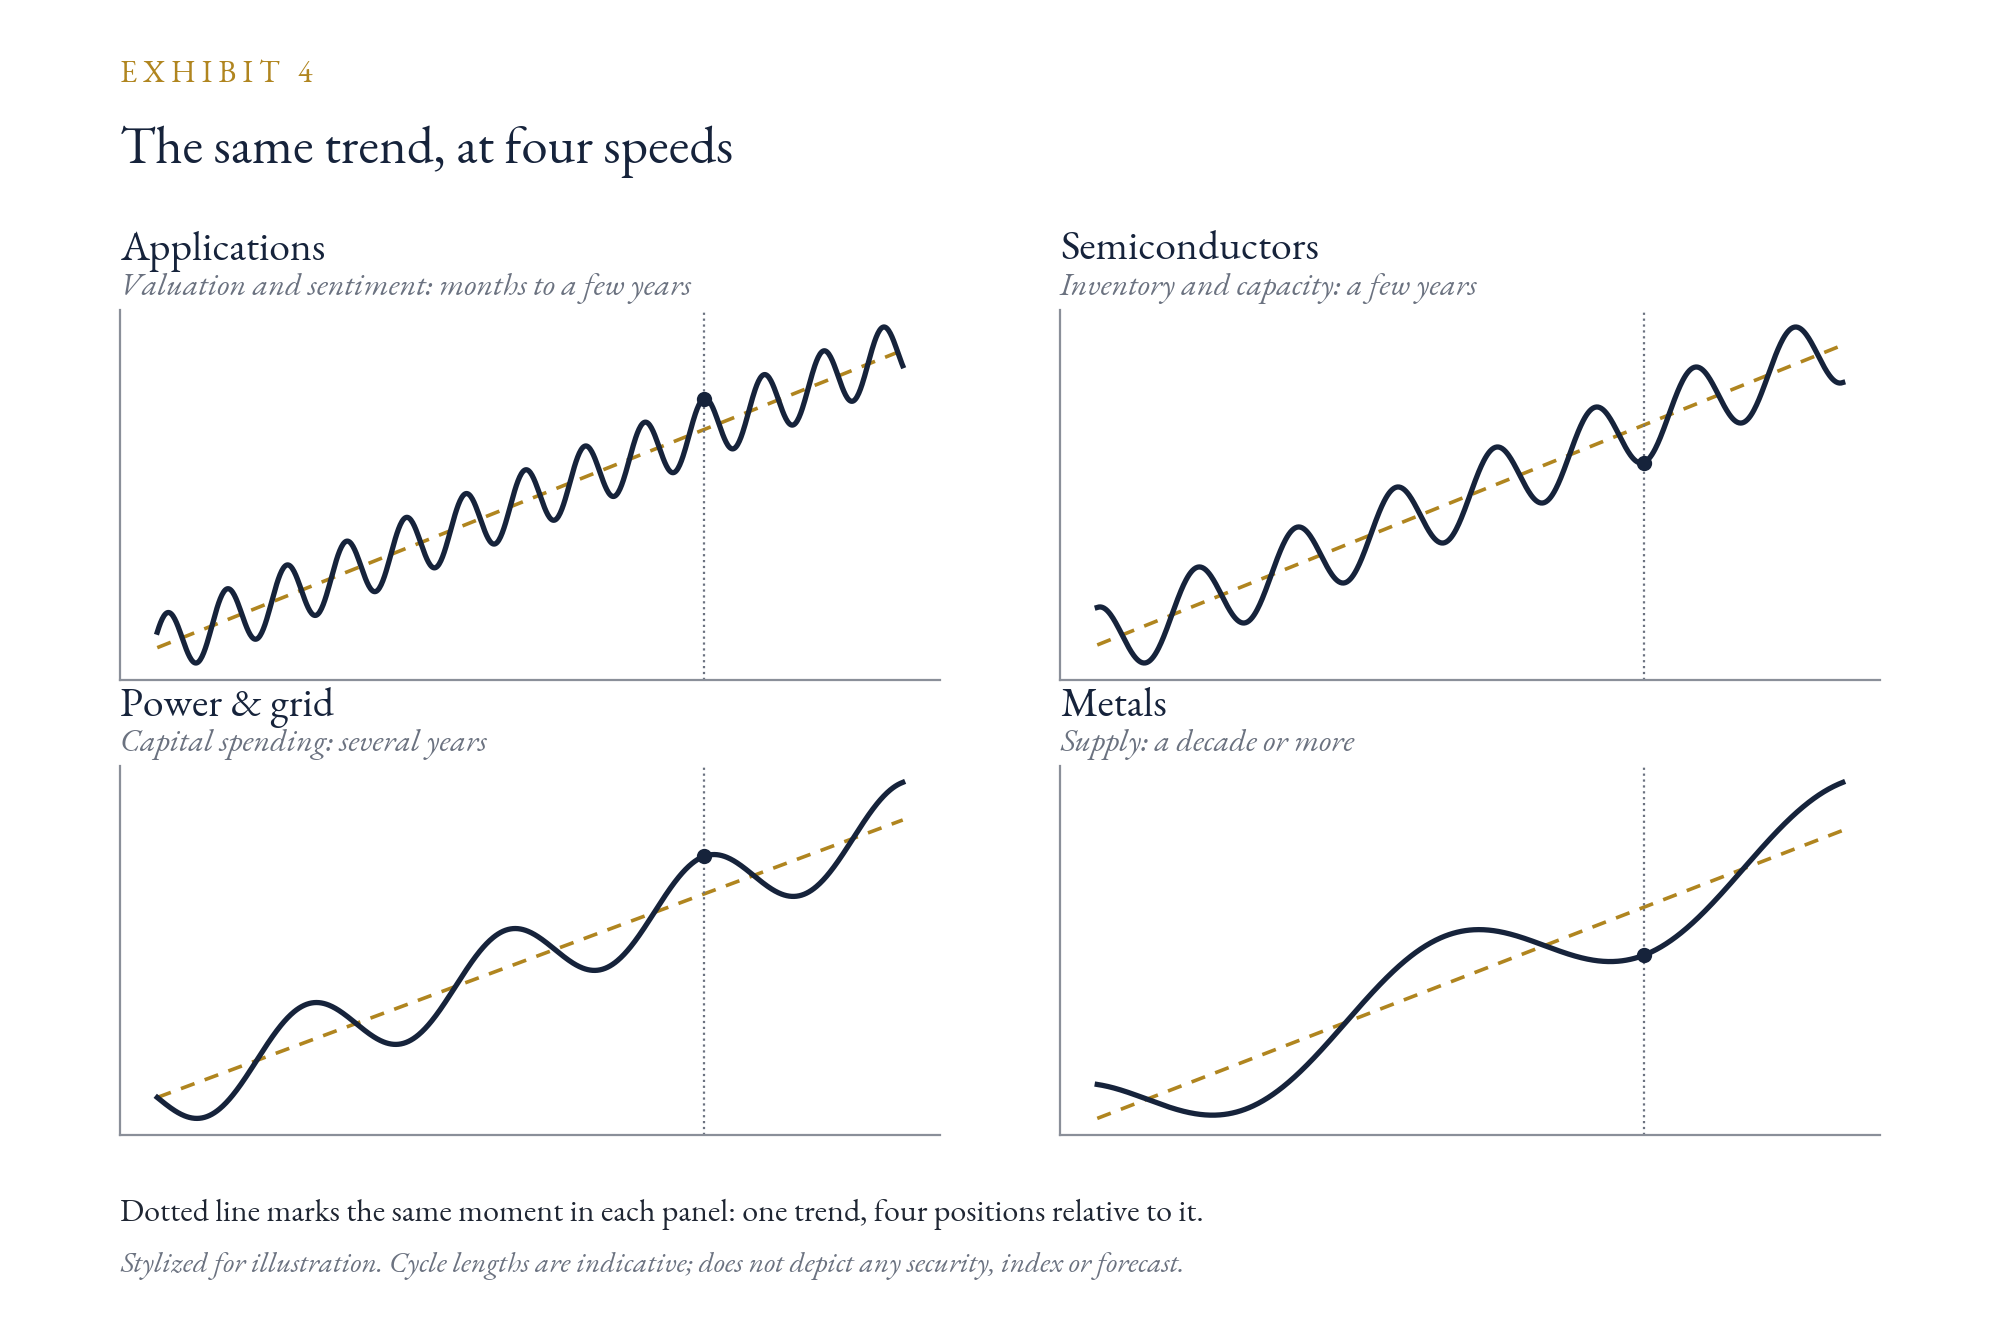
Because the clocks run at different speeds, the layers drift apart relative to their own trends. At any moment one may sit well above its long-run path while another sits below. A static portfolio treats the four as one exposure and misses that divergence. A cycle framework uses it.
In practice, the trend commitment stays constant. Structural weights across all four layers are set for the long run and held through volatility. Where each layer sits relative to its own trend then informs three decisions: when to rebalance, where new capital goes, and modest tilts across layers within set limits. The cycle adjusts how the trend is held. It never overrides it.
How that plays out depends on the account. In a taxable account, the cycle is best expressed through cash flows (new money, distributions and harvested losses), because frequent trading tends to cost more in tax than it earns. In tax-deferred and tax-exempt accounts, rebalancing can follow the cycle more directly.
Understanding the Tradeoffs
A portfolio built on this trend is an equity portfolio, and it will fall with equities. Semiconductor makers and miners are among the most volatile parts of the market. In a broad decline, or a pullback in AI spending, exposure across the chain can fall by more than a broad index. The cycle work shapes the timing of rebalancing and new investment. It does not move to cash.
The larger risk is overbuilding. Every general-purpose technology build-out has overshot at some point. Railways in the 1840s and fiber optics in 2000 both changed the economy, and many of the investors who financed them did not share in the result. The strain is already visible in cash flow: Alphabet's free cash flow turned negative in the second quarter of 2026 as capital spending rose.[7] Leadership within a layer can change quickly as architectures shift, a handful of large companies dominate software and compute, and the resource layer carries policy risk from export controls and the geography of supply.
We would change our view if capital spending kept rising for several years while AI revenue failed to follow, if electricity use and data center construction fell back toward their pre-2023 path, or if cheaper compute shrank total demand rather than expanding it. The honest difficulty is that a deep deviation and a broken trend look the same at first. Telling them apart takes time, and every estimate of trend is least certain near a turning point. We would rather say so plainly.
Closing
The question most investors ask about AI is which company will win. It is a hard question, and history suggests the answer often changes. The more useful questions are structural. Is the trend visible in physical data rather than in narrative? Where does capital flow as the build-out proceeds, and where is supply slowest to respond? Which parts of the chain sit above their long-run path, and which sit below?
Those questions do not require a forecast of the next cycle. They require a framework that owns the trend and respects the cycle. How that translates into a specific portfolio depends on each client's existing exposure, account structure, tax circumstances and tolerance for equity volatility. The conceptual work is what we make public. The portfolio work happens one client at a time.
Sources and Disclosures
[1] Arthur F. Burns and Wesley C. Mitchell, Measuring Business Cycles, National Bureau of Economic Research, 1946.
[2] U.S. Census Bureau, Monthly Construction Spending, July 2026, released September 1, 2026. Seasonally adjusted annual rate, private data center construction.
[3] Company capital-spending guidance for Alphabet, Amazon, Meta and Microsoft, as reported through August 2026. Figures are company plans and are subject to change.
[4] U.S. Energy Information Administration, Short-Term Energy Outlook, September 2026.
[5] Lawrence Berkeley National Laboratory, 2024 United States Data Center Energy Usage Report, December 2024.
[6] John T. Cuddington and Daniel Jerrett, "Super Cycles in Real Metals Prices?", IMF Staff Papers, 2008.
[7] CNBC, July 28, 2026.
Exhibit 2: U.S. Census Bureau, Value of Private Construction Put in Place (not seasonally adjusted), deflated to 2021 dollars by Our World in Data using BLS producer price indexes for new nonresidential building construction; data through June 2026. Exhibits 1, 3 and 4 are stylized for illustration.
Koios Private Family Offices, LLC is an Iowa-registered investment adviser. Registration does not imply skill or training. This general educational material is not individualized advice or a recommendation. Company and sector references are illustrative, not complete analyses. Koios may hold discussed securities in client accounts. Past performance and forecasts do not guarantee future results. Advisory services are offered only where Koios is appropriately registered, notice-filed, exempt or excluded.



Built for Depth
2600 Grand Avenue, Suite 290
Des Moines, IA 50312