
The Real Estate Portfolio That Evolves


Most investors build portfolios around stocks and bonds. Real estate is another major asset class, but many investors encounter it first through direct ownership. Buying a building, finding tenants, replacing the roof and managing vacancies can be costly, illiquid, operationally demanding and difficult to scale. Even wealthy direct owners often hold only a few properties in one community or region. Repositioning those holdings as growth shifts from offices to logistics, or from traditional retail to digital infrastructure, can take years and involve significant cost.
A real estate investment trust, or REIT, offers a different way to own the asset class. A publicly traded equity REIT is a company that owns or operates income-producing real estate. Investing through a diversified REIT index fund gives an investor a proportional claim on professionally managed portfolios spanning many properties, markets and property types, without owning or maintaining a building directly. To maintain REIT status, a company generally must distribute at least 90% of its taxable income to shareholders, which has long contributed to REITs’ reputation as income investments. Their history, however, shows a second and less appreciated attribute: the capacity for long-term capital growth.
A REIT index is not a static collection of buildings. Its composition evolves with the economy as new property types enter the public market, successful sectors grow into larger index weights and older sectors become less dominant. Direct investors rarely reposition their holdings this continuously; the cost, concentration and illiquidity of physical property make that difficult.
That ability to evolve, while preserving the income-producing character of real estate, is the most important feature of the asset class today.
One Asset Class, Many Return Drivers
Through August 31, 2026, the FTSE Nareit All Equity REITs Index generated a 14.5% total return, compared with 13.5% for the Dow Jones U.S. Total Stock Market and 13.0% for the Russell 1000. The result is notable because the 10-year Treasury yield ended August at 4.75%: elevated rates did not prevent listed real estate from outperforming the broader equity market year to date.[1]
The aggregate return also concealed substantial differences among property types. Lodging/resorts led with a 36.6% year-to-date total return, followed by data centers at 33.0% and specialty REITs at 30.2% (Exhibit 1).[1] Those businesses respond to different demand cycles (travel, computing infrastructure and specialized property markets), which is precisely why a modern REIT index should not be treated as one homogeneous interest-rate trade.
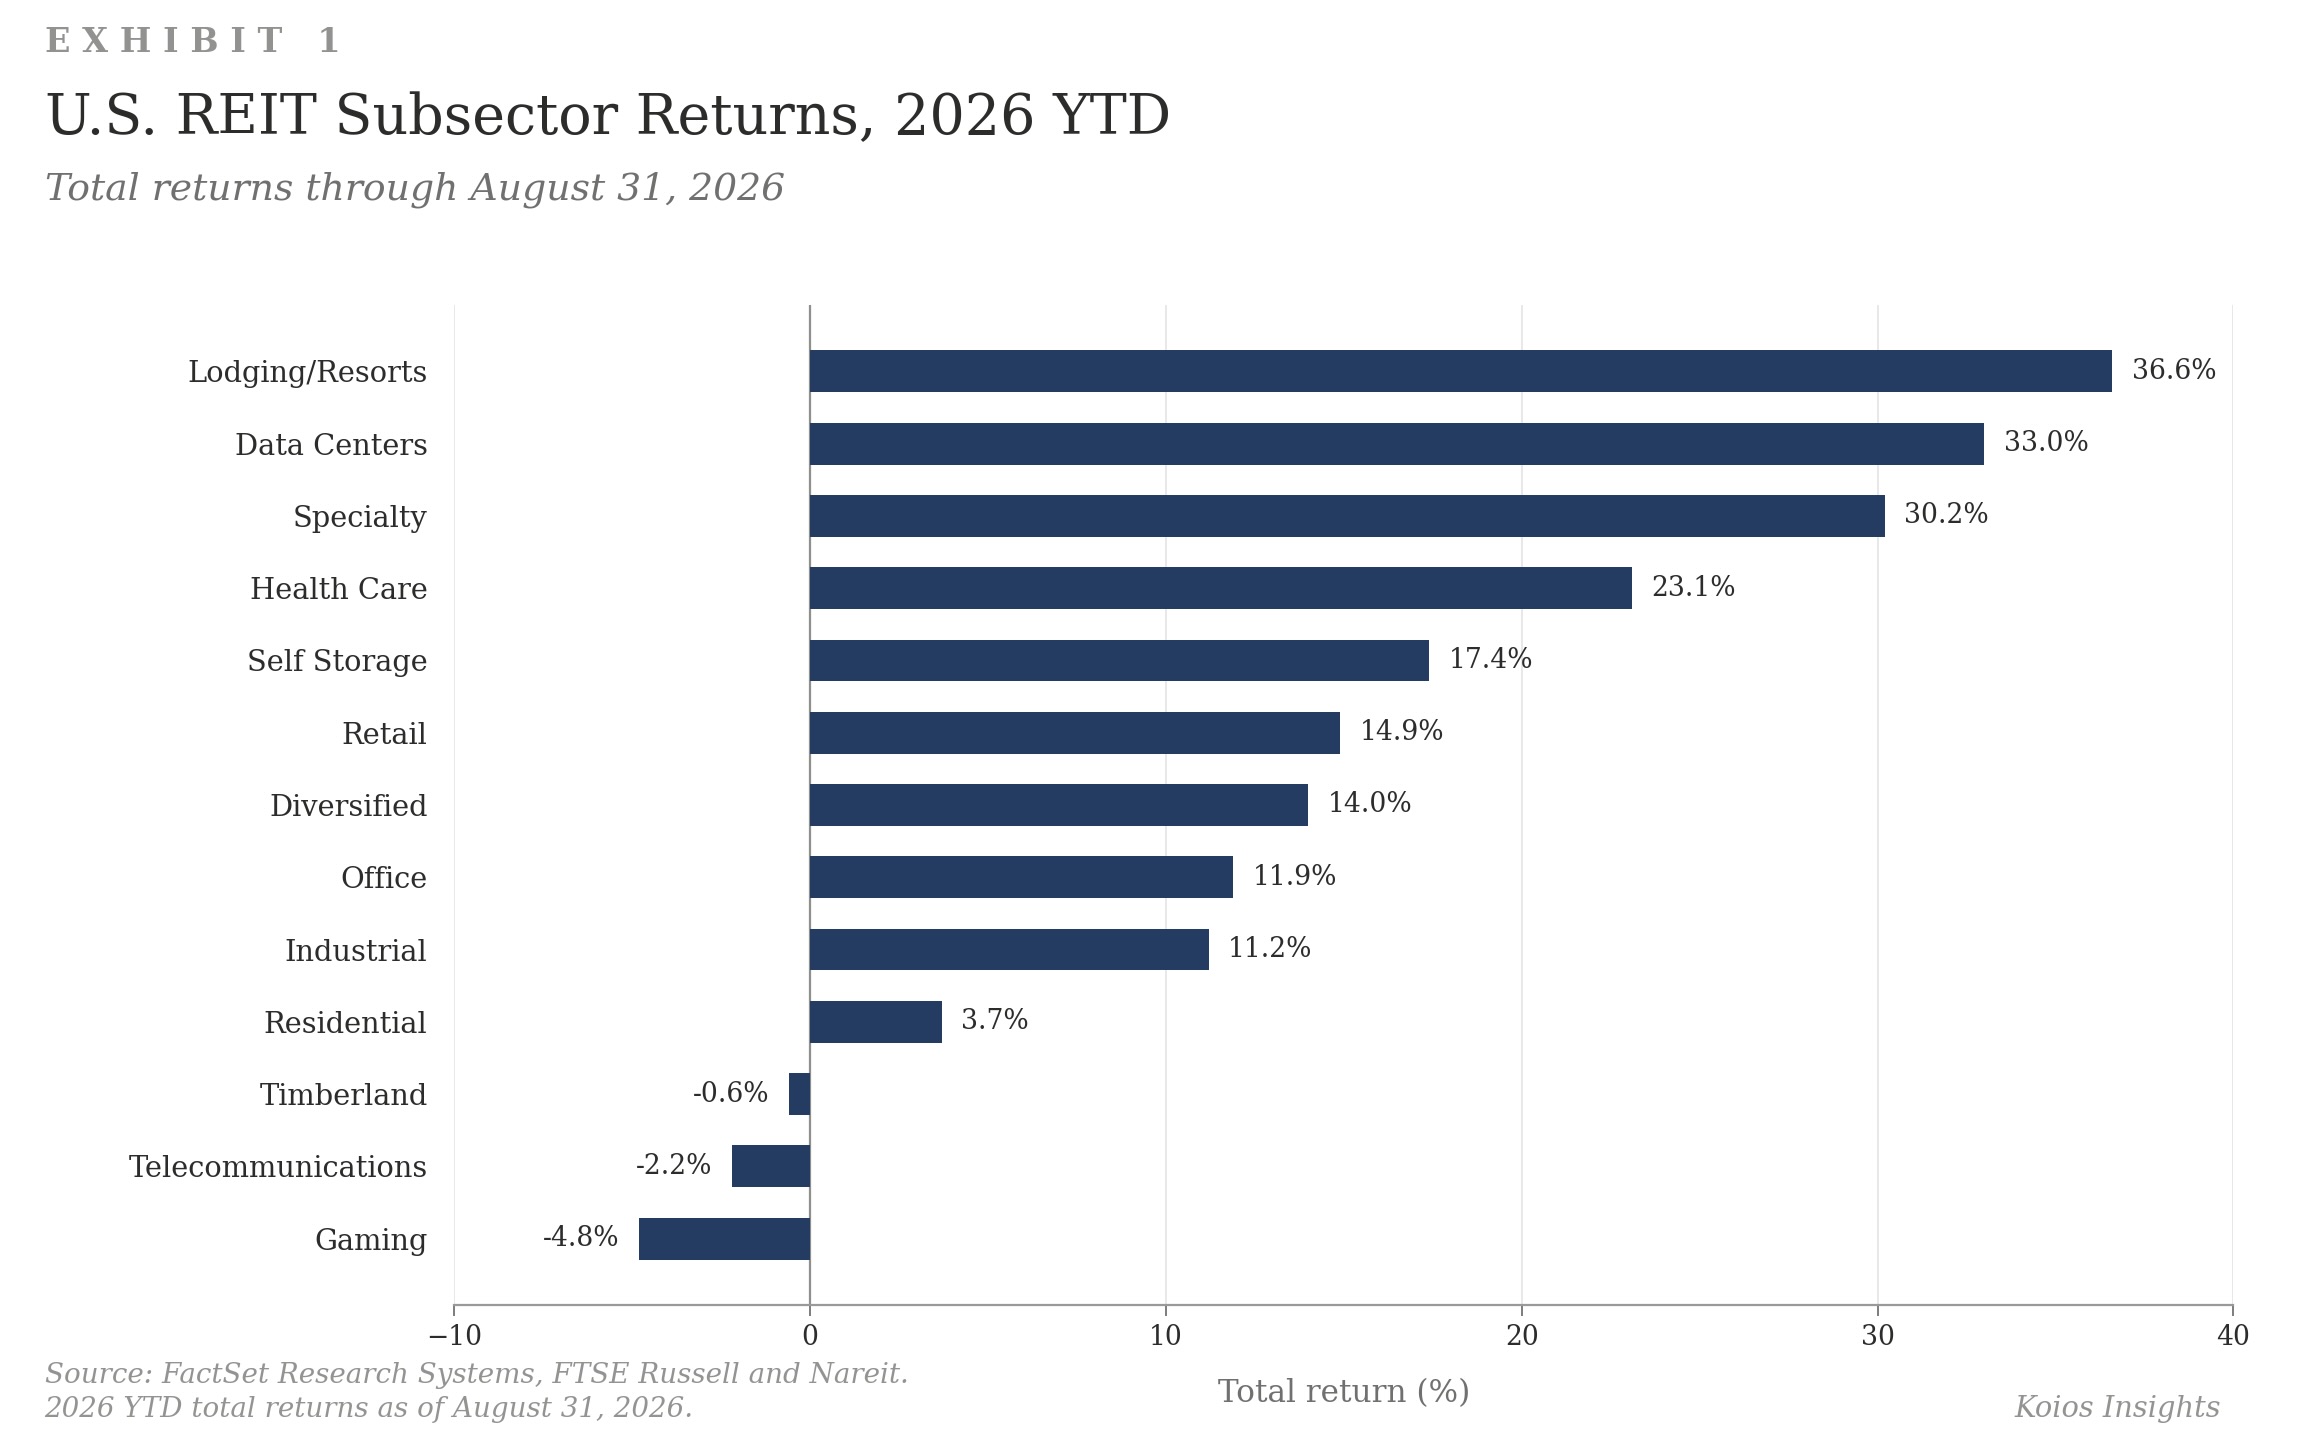
August itself illustrates the distinction. The All Equity REITs Index declined 2.7% while the Russell 1000 gained 2.8% and the Dow Jones U.S. Total Stock Market gained 2.7%. Even within listed real estate, telecommunications returned 1.6%, data centers were flat, and lodging/resorts fell 8.0%.[1] One month proves little, but the divergence reinforces the broader point: REIT returns reflect property-level demand, supply, operating results and financing conditions, not merely the direction of the stock market or interest rates.
An Investment Universe That Evolves
REITs have always combined income with growth. From January 1991 through July 2023, the FTSE Nareit All Equity REIT Index generated a 10.63% annualized total return. Reinvested dividends accounted for 53.22% of the cumulative return, but capital appreciation also contributed meaningfully to long-term wealth creation.[2] In the 1990s, growth came from consolidating a fragmented private market, developing and acquiring properties, and raising occupancy and rents. These were never static bond portfolios.
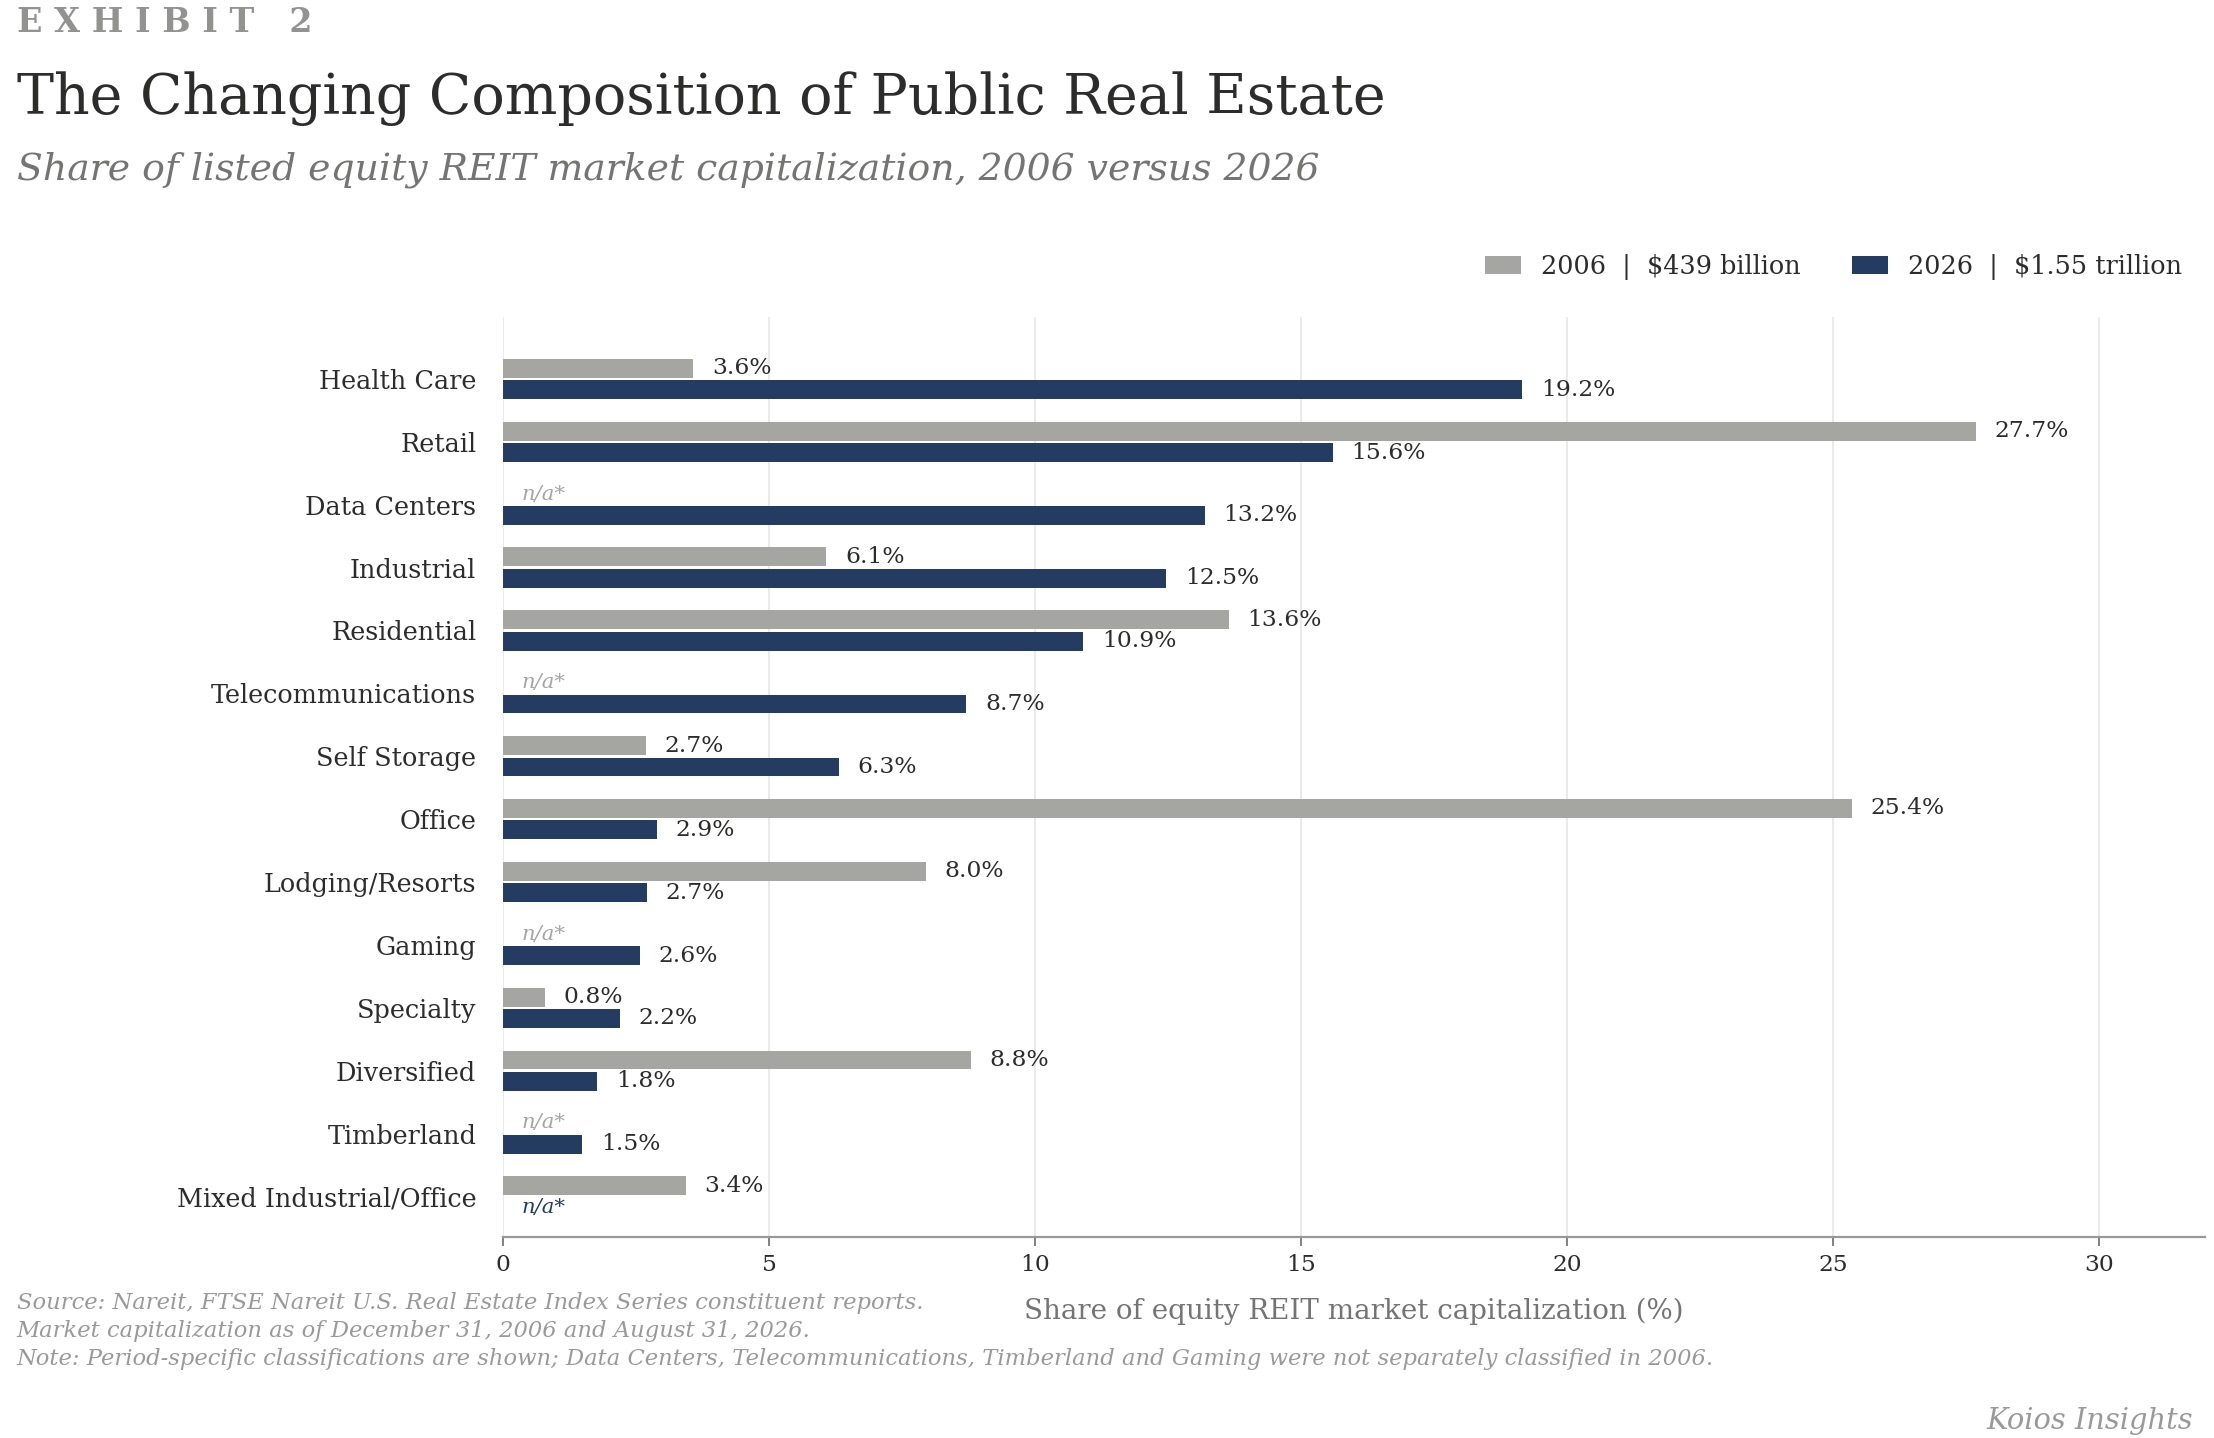
What changed was the source and duration of growth. Retail, residential, office and industrial REITs represented at least 70% of listed equity REIT market capitalization through much of the 1990s and 2000s. By 2021, newer and emerging sectors represented 41% of market capitalization, up from only 6% in 2000.[3] The shift is visible within a single decade: in 2010, industrial REITs were just 4% of market capitalization, towers had not entered the index series and data centers were not separately classified. By year-end 2020, industrial, tower and data-center REITs together represented 39%.[4]
The composition of another widely followed benchmark, the MSCI US REIT Index, makes the change concrete. As of July 31, 2026, the MSCI US REIT Index held 104 companies, and its three largest constituents were Welltower, Prologis and Equinix (senior housing and health care, logistics, and data centers) with a combined weight of 29.5%.[5] Investors in the index now gain greater exposure to businesses tied to long-duration forces such as computing, mobile data, e-commerce logistics and demographics, as well as to more operating-company economics. Contractual rent is no longer the whole story.
Senior housing industry leader Welltower, a health care REIT with substantial senior-housing exposure, illustrates the change. Unlike a shopping center collecting rent under long leases, much of its senior-housing income moves with occupancy, resident rates and operating costs. It behaves partly like a landlord and partly like an operating platform. Welltower is now the largest constituent of the MSCI US REIT Index, at 12.2% as of July 31, 2026.[5] Its position reflects demographics, capital allocation and operating execution, not rent collection alone.
The demographic foundation is unusually visible. The oldest baby boomers turn 80 in 2026, and the U.S. population age 80 and older is projected to double from 14.7 million in 2025 to 29.4 million in 2045.[6] That does not translate mechanically into senior-housing demand: affordability, health, family support and consumer preferences still matter. But the size and direction of the potential customer base are considerably more observable than demand in most property markets.
Supply is moving much more slowly. Across the 99 primary and secondary markets tracked by NIC MAP, senior-housing occupancy reached 90.1% in the second quarter of 2026, its highest level since late 2007. At the same time, fewer than 24,000 units were under construction, the lowest level since mid-2012. With a typical lag of roughly two years from groundbreaking to opening, today's low level of construction limits near-term supply growth.[7] This is a cycle in demographics, construction and operations, not simply an interest-rate trade.
Capital Access as a Competitive Advantage
Listed REIT balance sheets entered the second half of 2026 in a comparatively disciplined position. At the end of the second quarter, debt represented approximately 34% of market assets (a measure directionally comparable to property-level loan-to-value), although the two are not calculated identically. Approximately 90% of total debt was fixed rate, roughly 83% was unsecured and the weighted-average term to maturity was just under six years.[8] Company-level leverage varies widely, but this structure can reduce near-term refinancing pressure and preserve capacity to invest when more highly leveraged owners are constrained.
Public REITs can also raise debt or equity as market conditions change. During the first half of 2026, U.S. REITs raised $36.2 billion: $17.6 billion through debt offerings, $14.7 billion through common equity offerings, $370 million through preferred equity and $3.5 billion through initial public offerings.[9] That access can fund acquisitions and development or strengthen balance sheets, although issuing shares below intrinsic value can dilute existing owners.
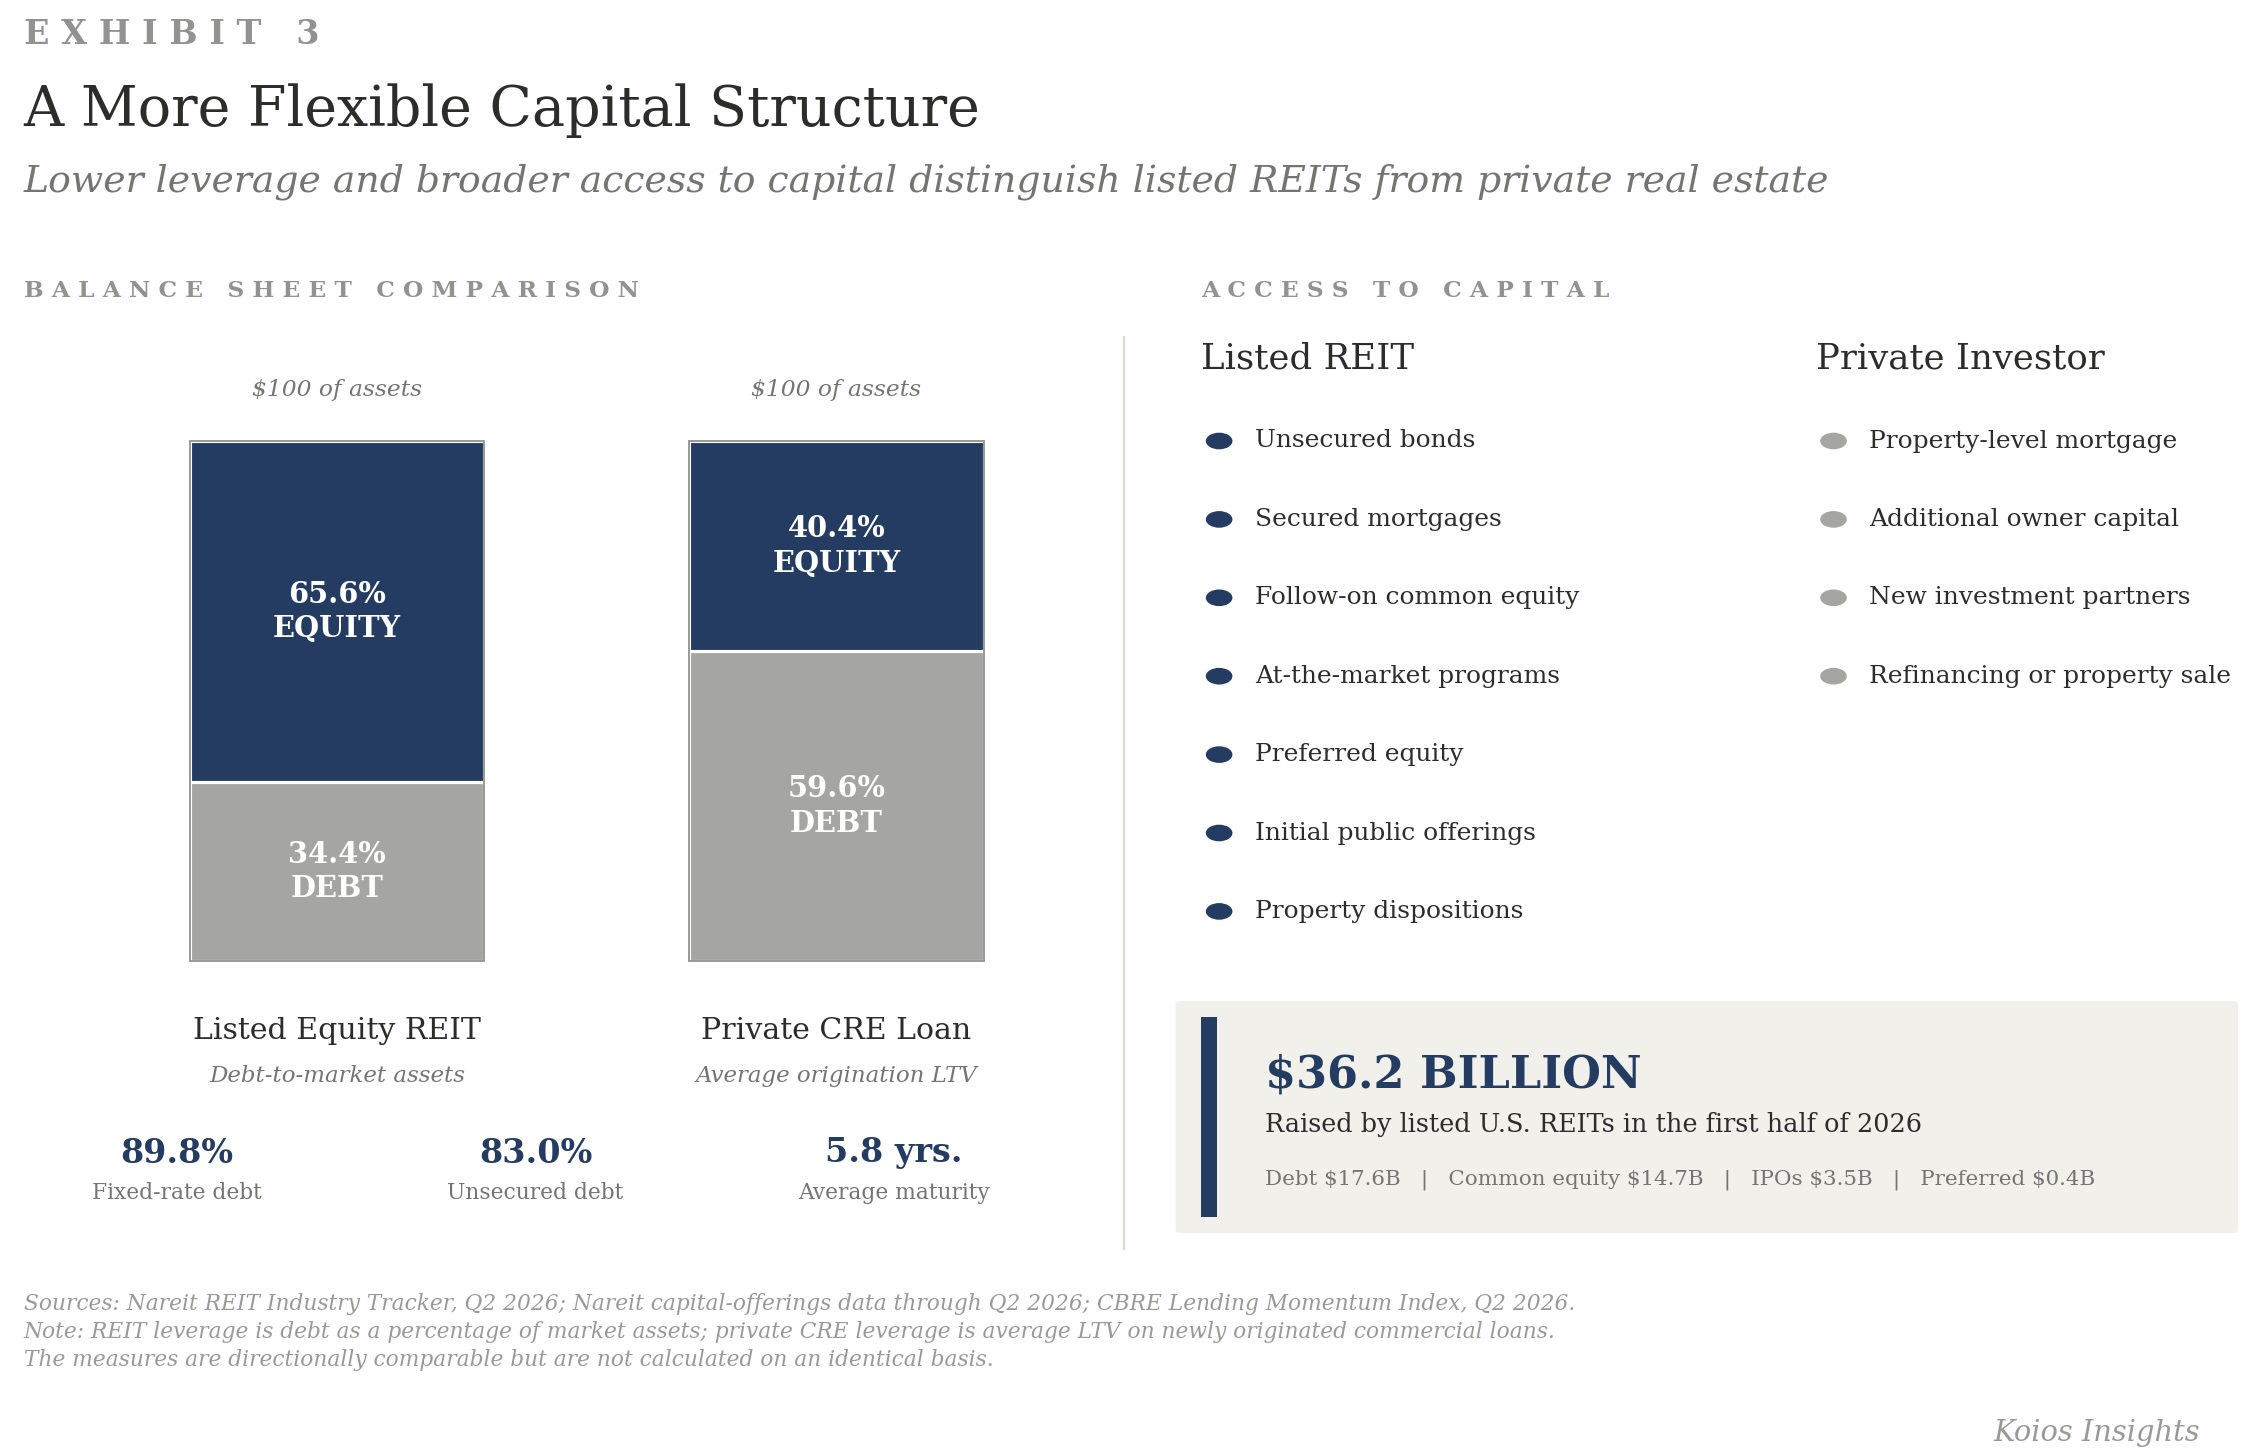
A REIT is therefore more than property plus a dividend. It is a capital-allocation platform: a portfolio of assets, a balance sheet and a management team deciding when to buy, build, sell or issue capital. Direct investors have those same decisions, but usually without the same diversification, liquidity or access to public markets.
Investing Through Cycles
Our work at Koios is built around economic regimes: identifying the environment the economy is actually in from the behavior of assets, rather than relying on a forecast of what should happen next. Modern REITs fit that framework. Data-center demand follows investment in computing. Warehouses follow production, inventories and commerce. Senior housing follows demographics, construction and labor.
Interest rates still matter, but they are one input among several. Earnings, occupancy, supply, leverage, valuation and access to capital can be equally important. The modern REIT market did not stop being rate sensitive; it became too economically diverse to explain through rates alone.
Understanding the Tradeoffs
The structural case does not eliminate real-estate or equity-market risk. Higher financing costs can reduce property values; new supply can weaken rents and occupancy; tenants and operators can fail; and public REIT prices can fall sharply even when underlying properties appear sound. Dividends may be reduced, correlations may rise during market stress, and sector or company concentration can magnify losses. These risks remain meaningful, but they are also more varied (and more property-specific) than many investors appreciate.
Closing: An Adaptable Way to Own Real Estate
Owning a modern REIT index is not simply owning "real estate." It is owning an evolving portfolio of economic exposures (computing, logistics, communications, demographics and other demand drivers) housed in physical assets and financed through public companies.
The right question is therefore larger than whether rates are headed up or down. What do the assets do? What drives demand? How constrained is supply? How strong is the balance sheet? And what price are you paying? That is what you actually own.
Sources and Disclosures
[1] John Barwick, 'REITs Underperform Broader Markets in August, Continue to Lead Year-to-Date,' Nareit, September 2, 2026; data through August 31, 2026.
[2] Nareit, 'Looking for Income? REITs Deliver,' August 3, 2023.
[3] Nareit, 'Not Your Grandad's REIT,' August 30, 2016, and Nareit sector data through December 31, 2021.
[4] Nareit, 'The Evolving Real Estate Landscape and REIT Indexes,' September 10, 2021.
[5] MSCI US REIT Index, data as of July 31, 2026.
[6] Brookings Institution analysis of U.S. Census Bureau 2023 National Population Projections, 2025-2045.
[7] NIC MAP, second-quarter 2026 market data, updated August 19, 2026.
[8] Edward F. Pierzak, 'REITs Ready for Growth with Disciplined, Well-Structured Balance Sheets,' Nareit, August 26, 2026; balance-sheet data for the second quarter of 2026.
[9] John Barwick, 'REITs Raised $20 Billion in Capital Offerings in 2026: Q2,' Nareit, July 21, 2026; capital-raising data through June 30, 2026.
Koios Private Family Offices, LLC is an Iowa-registered investment adviser. Registration does not imply skill or training. This general educational material is not individualized advice or a recommendation. Company and sector references are illustrative, not complete analyses. Koios may hold discussed securities in client accounts. Past performance and forecasts do not guarantee future results. Advisory services are offered only where Koios is appropriately registered, notice-filed, exempt or excluded.




Built for Depth
2600 Grand Avenue, Suite 290
Des Moines, IA 50312